Memory Leak C#
Contents
- What Is A Memory Leak?
- What Causes Memory Leaks?
- .NET Memory Leak
- Memory Profiler
- Memory Terminology
- How To Check For Memory Leaks
- Leaky App Demo
- Memory Leak Analysis With DotMemory
- Memory Leak Analysis With PerfView
- Memory Leak Analysis With OzCode
- Further Reading
- References
What Is A Memory Leak?
In general, a memory leak is a process in which a program or application persistently retains a computer’s primary memory. It occurs when the resident memory program does not return or release allocated memory space, even after execution, resulting in slower or unresponsive system behavior.
In unmanaged code, a memory leak is a failure to release unreachable memory, which can no longer be allocated again by any process during execution of the allocating process. This can mostly be cured by using GC (Garbage Collection) techniques or detected by automated tools.
However,
In managed code, a memory leak is a failure to release reachable memory which is no longer needed for your program to function correctly. This is nearly impossible to detect with automated tools or by programmers who are not familiar with the code. While technically it is not a leak, it has the same implications as the naive one. You can come across projects that are written in a garbage collected language but still mention fixing memory leaks in their changelogs.
What Causes Memory Leaks?
There are many forms of leaks:
- Unmanaged leaks (code that allocates unmanaged code)
- Resource leaks (code that allocates and uses unmanaged resources, like files, sockets)
- Extended lifetime of objects
- Incorrect understanding of how GC and .NET memory management works
- Bugs in the .NET runtime
The first two is usually handled by two different pieces of code:
- Implementing IDisposable on the object and disposing of the unmanaged memory/resource in the Dispose method
- Implementing a finalizer, to make sure unmanaged resources are deallocated when GC has found the object to be eligible for collection
The third, however, is different.
Say you are using a big list holding thousands of objects, totaling a significant size of memory. If you keep around a reference to this list for longer than you need to, you will have what looks like a memory leak. Also, if you keep adding to this list so that it grows with more data periodically, and old data is never reused, you have a memory leak.
One source of this I’ve seen frequently is to attach methods to event handlers but forget to unregister them when you’re done, slowly bloating the event handler both in size and code to execute.
The fourth, an incorrect understanding of how .NET memory management works can mean that you look at the memory usage in a process viewer and notice that your app keeps growing in memory usage. If you have lots and lots of memory available, GC might not run that often, giving you an incorrect picture of the current usage of memory, as opposed to the mapped memory.
Also,
If you have a long-running method (for instance, it might be processing files on disk, or downloading something, or similar), and you used a reference to a big data-structure early in the method, before the long-running part, and then you don’t use that data structure for the rest of the method, then .NET, in release-builds (and not running under a debugger) is smart enough to know that this reference, though it is held in a variable that is technically in scope, is eligible for garbage collection. The garbage collector is aggressive in this respect.
However,
In debug-builds and running under a debugger, it will keep the reference for the life of the method, in case you want to inspect it when stopped at a breakpoint.
But,
If the reference is stored in a field reference in the class where the method is declared, it’s not so smart, since it’s impossible to determine whether it will be reused later on, or at least very very hard. If this data structure becomes unnecessary, you should clear the reference you’re holding to it so that GC will pick it up later.
.NET Memory Leak
Many of us were taught that .NET manages memory automatically. There is no need to explicitly free memory. It just kind of goes away with the garbage collector.
Though, It doesn’t mean we can’t have memory leaks.
We can still create objects that our application doesn’t need, and the GC thinks it still does. This can only happen because these objects are referenced by our application in one way or another. But unlike memory leaks in unmanaged languages, where the root cause of the leak is always something like forgetting to call free, forgetting to release memory explicitly, In managed languages, managed memory leaks can be a lot more subtle and difficult to identify.
But,
We have excellent tools for diagnosing memory leaks in. NET applications. And these tools have an intimate understanding of the heap structure. So they can determine when an object refers to another object, and follow chains of references that keep the memory from being freed.
To understand how memory leaks are formed, and how to diagnose them, we have to talk about GC roots briefly.
GC roots are the starting point for the CLR garbage collector. It starts from roots and visits referenced objects recursively, and then it traverses the entire reachable graph of live objects. And roots in the CLR include local variables and methods that are currently executing, static fields, and some more obscure locations like finalization handles and GC handles.
There’s a memory leak if the GC identifies an object as live, but we don’t really need it. So there is a leak if an object is reachable from roots but we would like it to be reclaimed.
Of course, it can be really hard to identify by hand, which root is responsible for keeping an object alive. And, in some cases, the object might be reachable from multiple roots.
In other cases, it will be reachable only from a single root, but through a variety of different paths. And so we need automatic tools that can aggregate a lot of information and point out which patterns are responsible for large parts of memory that aren’t being freed.
Memory Profiler
Visual Studio provides a variety of profiling tools to help you diagnose different kinds of performance issues depending on your app type.
The profiling tools that you can access during a debugging session are available in the Diagnostic Tools window. The Diagnostic Tools window appears automatically unless you have turned it off.
While you are debugging, you can use the Diagnostic Tools window to analyze CPU and memory usage, and you can view events that show performance-related information.
You can learn how to measure memory usage using the Memory Usage tool in Visual Studio here.
Diagnostic Tools window and Events tab run only during debugging sessions.
However,
Performance Profiler tools like Application Timeline can run on Debug or Release builds.
You can learn how to collect profiling data without debugging using the Performance Profiler tool in Visual Studio here.
The non-debugger Performance Profiler and the debugger-integrated Diagnostic Tools provide different information and experiences. Debugger-integrated tools show you breakpoints and variable values. Non-debugger tools give you results closer to the end-user experience.
But,
In the demo below, we’re going to use a different tool to perform memory profiling. And it’s not that I don’t like Visual Studio’s memory profiler, but rather I want to show you as many different tools as I can.
So, we are going to use the dotMemory profiler by JetBrains, Windows free performance-analysis tool PerfView, and OzCode a Visual Studio Extension which cuts down on debugging time.
Memory Terminology
This is a good time to agree on some memory profiling terms you’ll come across while using memory profiler.
From a memory perspective, the work of your application consists of a continuous allocation of memory for new objects and releasing the memory left from the objects that are no longer used by the app. Objects are allocated one after another in the so-called managed heap. Based on this, we have two basic operations a memory profiler must be able to do:
-
Get a memory snapshot. Snapshot is an instant image of the managed heap. Each snapshot contains the info about all the objects that your app has allocated in memory at the moment you take a snapshot.
-
Collect memory traffic information. Memory traffic shows you how much memory was allocated and released, e.g., between two memory snapshots. This info is also very valuable as it allows you to understand the dynamics of how your application performs.
The time interval during which you collect traffic and get snapshots (or, in other words, profile your application) is called profiling session.
There are a few fundamental concepts that might sound a little theoretical, but they’re very important for chasing leaks in complex systems.
So basically we’re looking for ways to aggregate information about many objects with many reference chains into something more digestible, that we can quickly glance at and understand.
So the first key concept is the shortest retention paths.
Shortest Retention Paths
There can be many ways for an object to be reachable from roots, but some of them are longer than others.
For example, consider this object’s graph. A is a GC root that refers to B, B refers to C1 and C2, C1 refers to D, and D refers to E, which finally refers to our target object F. But C2 refers to our target object F directly.

And so in many cases, the shortest path, which goes A, B, C2, and F, is more interesting than the longer reference path through C1 and D and E. And so if you can identify the shortest retention path for each object in the heap, we can group the objects by the shortest retention path.
For example, we might learn that there are a thousand objects of type F, that all have the same reference path, A to B to C2 to F. And this makes the reference path worth investigating and possibly trying to understand why it was formed, and how to break it apart.
And in some cases, breaking the shortest retention path also helps get rid of the longer paths.
Another group of important concepts is that of dominators, immediate dominators, and dominator trees.
Dominators
Dominator objects are comprised of a tree structure because each object has exactly one dominator. A dominator of an object may lack direct references to an object it dominates; that is, the dominator’s tree is not a spanning tree of the graph.
In the diagram below:

- Node 1 dominates node 2
- Node 2 dominates nodes 3, 4 and 6
- Node 3 dominates node 5
- Node 5 dominates node 8
- Node 6 dominates node 7
Dominators are interesting because of the following fact. If B dominates A, then by removing B from the graph, we guarantee that A is also removed from the graph because the only ways to reach A, were through B. So essentially, by taking care of one object, we can potentially take care of lots of other objects.
And so if we have a parent object that dominates many other objects, or dominates a lot of memory, it can be interesting to look at, because removing that kind of parent from the graph will help reclaim a lot of memory or remove lots of objects from the heap.
In the example below, node #3 is the dominator of #10, but #7 also exists in every simple path from GC to #10. Therefore, object B is a dominator of an object A if B exists in every simple path from the root to the object A.

How To Check For Memory Leaks
Locating a memory leak can be a simple, systematic process if you’re using the right tools. It involves four key steps.
-
You should identify that you’re leaking memory. You do this by continuously monitoring the application’s. NET memory utilization. Notice that occasional spikes aren’t enough. You need to be sure that memory is constantly on the rise, and that you’re at risk of eventually running out of memory.
-
You need to capture multiple snapshots of the application’s heap. Ideally, you’d capture them at large enough intervals apart, to easily see the memory leak. For example, 10 megabytes apart. In some cases, you have to settle for less because you can’t easily trigger the leak, or you aren’t sure which actions are invoking the leak. So you might have to settle for snapshots taken multiple hours apart and hope that you can separate the interesting data from the noise.
-
You need the tool to compare the heap snapshots, and determine which objects are being added, and are not reclaimed. And because modern applications can allocate millions of objects in a very short period, you need an automatic tool that will show you only the differences between the snapshots. Any objects that are accumulated over time and aren’t freed, are a leak suspect, and you need to take a closer look at them.
-
Now, the hardest part. You need to understand why these suspect objects aren’t getting collected, so in other words, why the GC thinks they are still alive, and what you can do to change it.
Leaky App Demo
In the following demo, we’re going to use a WPF application that creates around 50 clock windows on start button click. This clock windows subscribe to dispatcher Tick event which runs a UpdateTime method after every one-second interval and shows the current time.
In this example leak occurs when we don’t unregister our Clock class UpdateTime method from the dispatcher Tick event (within OnClosed window method).
Here is the code of MainWindow and Clock window to give you the idea. Also, you can find complete solution here.
MainWindow.xaml.cs
1
2
3
4
5
6
7
8
9
10
11
12
13
14
15
16
17
18
19
20
21
22
23
24
25
26
27
28
29
30
31
32
33
34
using System.Collections.Generic;
using System.Windows;

namespace LeakyApp
{
    public partial class MainWindow : Window
    {
        List<Clock> clocks = new List<Clock>();

        public MainWindow()
        {
            InitializeComponent();
        }

        private void Start_Click(object sender, RoutedEventArgs e)
        {
            for (int i = 0; i < 50; i++)
            {
                var clock = new Clock();
                clock.Show();
                clocks.Add(clock);
            }
        }

        private void Stop_Click(object sender, RoutedEventArgs e)
        {
            foreach (var clock in clocks)
            {
                clock.Close();
            }
            clocks.Clear();
        }
    }
}
Clock.xaml.cs
1
2
3
4
5
6
7
8
9
10
11
12
13
14
15
16
17
18
19
20
21
22
23
24
25
26
27
28
29
30
31
32
33
34
35
36
37
38
using System;
using System.Windows;
using System.Windows.Threading;

namespace LeakyApp
{
    public partial class Clock : Window
    {
        DispatcherTimer timer;

        public Clock()
        {
            InitializeComponent();
            timer = new DispatcherTimer
            {
                Interval = new TimeSpan(0, 0, 1)
            };

            timer.Start();
            timer.Tick += UpdateTime;
        }

        private void UpdateTime(object sender, EventArgs e)
        {
            timerText.Content = DateTime.Now.ToLongTimeString();
        }

        protected override void OnClosed(EventArgs e)
        {
            base.OnClosed(e);

            //Uncommnet below lines to stop memory leak

            //timer.Tick -= UpdateTime;
            //timer.Stop();
        }
    }
}
Cause of Event Handler memory leaks?
While an event handler is subscribed, the publisher of the event holds a reference to the subscriber via the event handler delegate (assuming the delegate is an instance method).
If the publisher lives longer than the subscriber, then it will keep the subscriber alive even when there are no other references to the subscriber.
If you unsubscribe from the event with an equal handler, then yes, that will remove the handler and the possible leak.
Memory Leak Analysis With DotMemory
Analysing Leaky App
In this demo, we’re going to analyze a memory leak in a simple WPF application we discussed before LeakyApp. The memory leak isn’t automatic, it is triggered by explicit UI actions, so in other words, the app doesn’t just leak in the background. It only leaks memory if we perform certain operations.
And this is really common for GUI apps in general. So we’re going to start by a more powerful memory profiler called dotMemory by JetBrains, to get more insight about the memory leak’s origins.
You can download DotMemory from the JetBrains website.
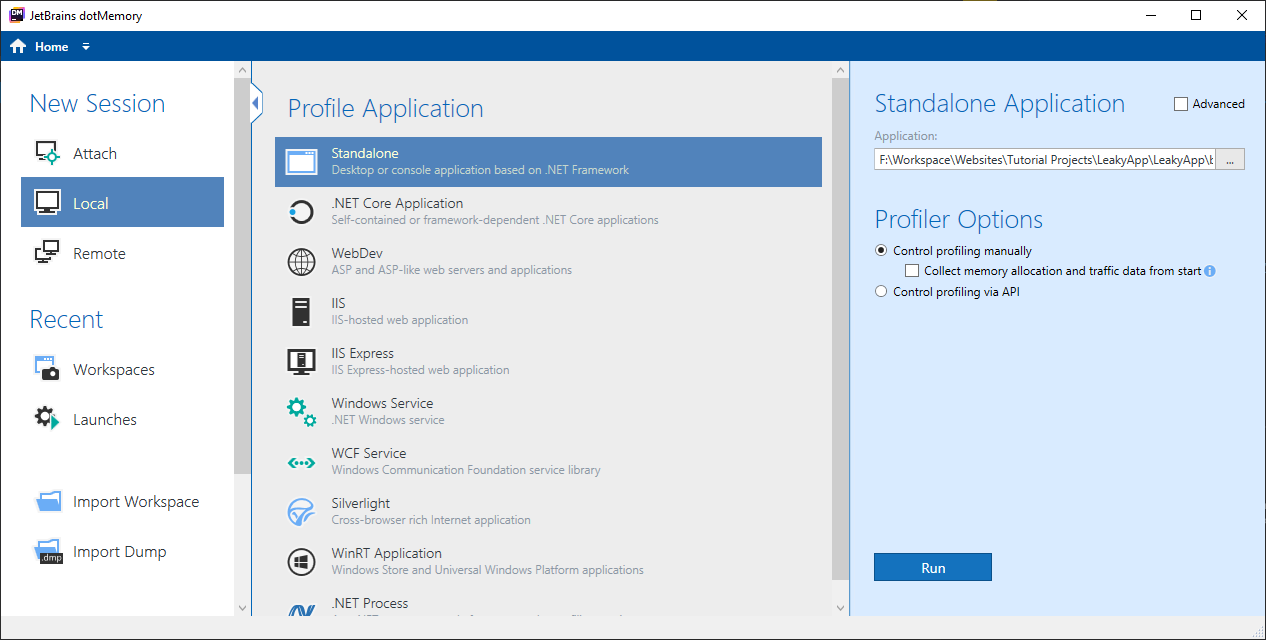
Step 1
Start the JetBrains dotMemory application and select Local > Standalone. In Standalone Application Box select application you want to profile, Leaky App in our case (You can find exe file in the debug folder).
Step 2
You will able to see the Analysis window along with the LeakyApp application.
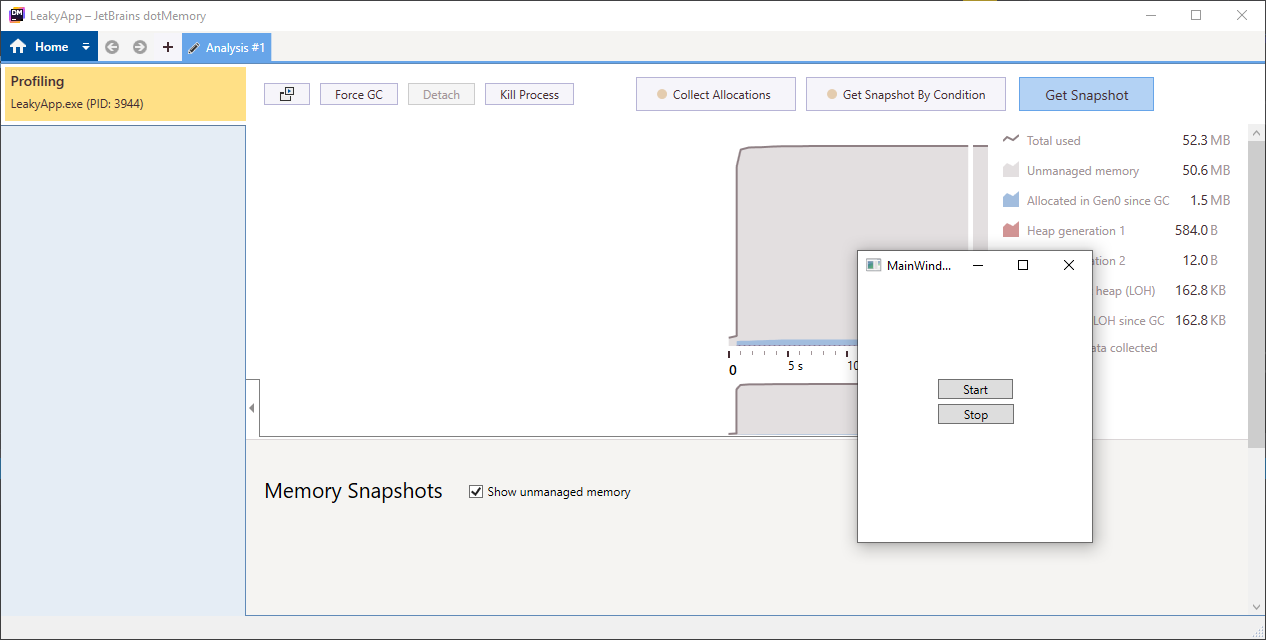
Click on the Get Snapshot button to take the memory snapshot.
Step 3
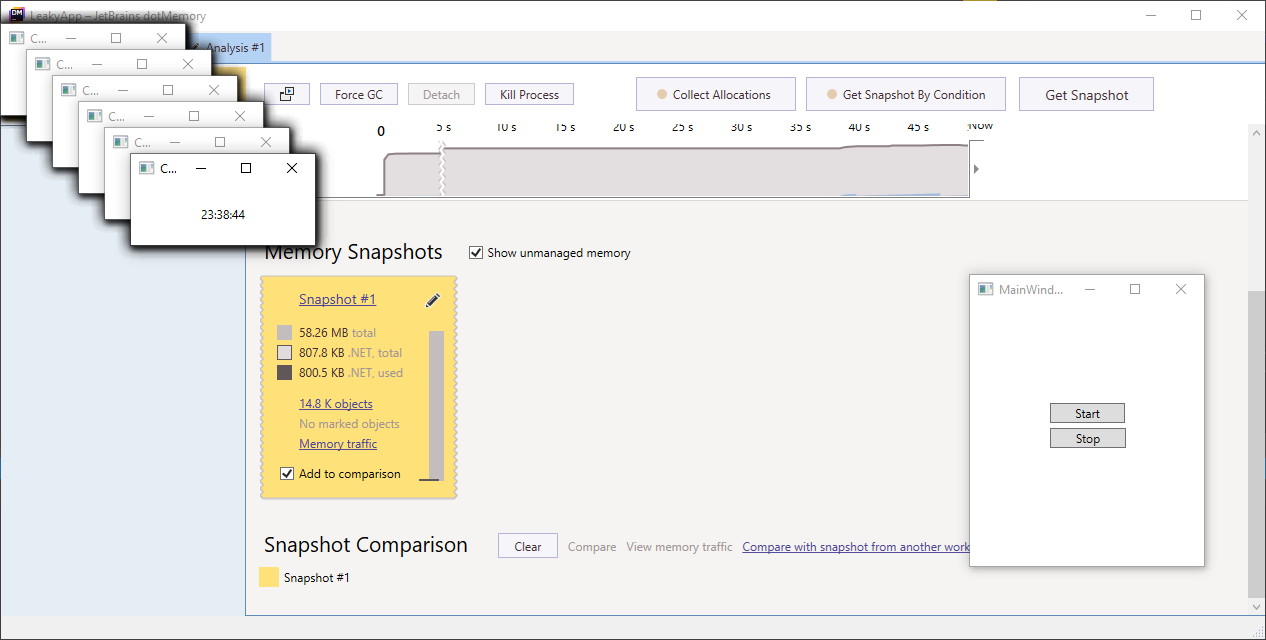
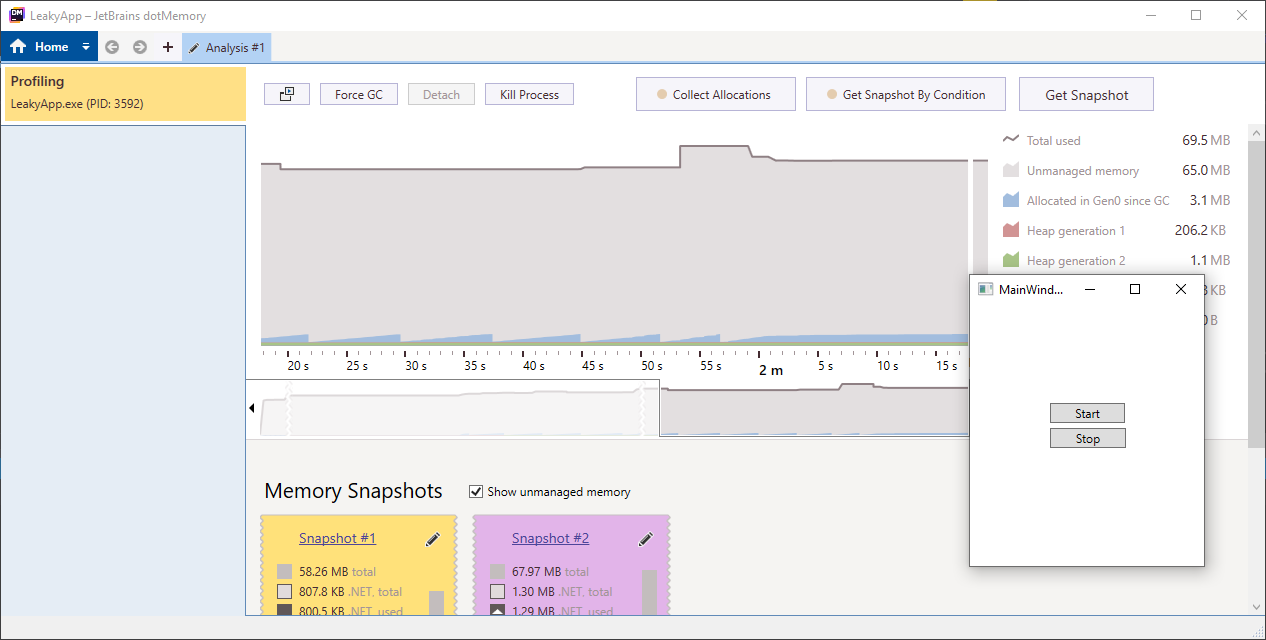
Click on the Start button which will open 50 clock windows.
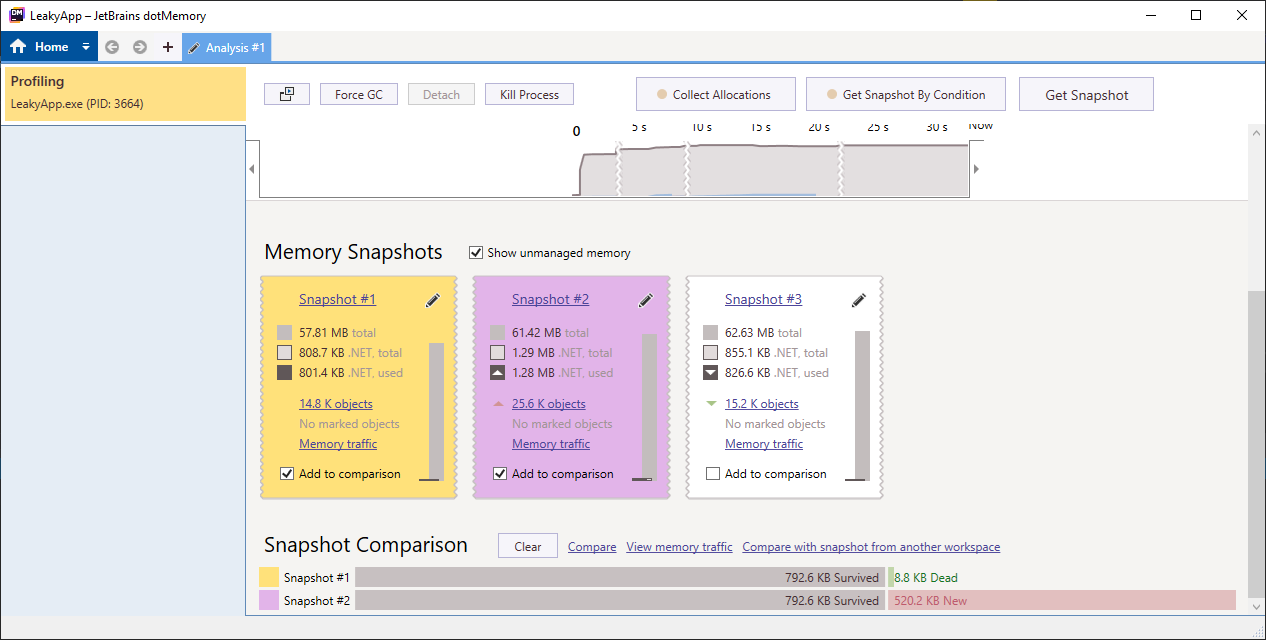
Step 4
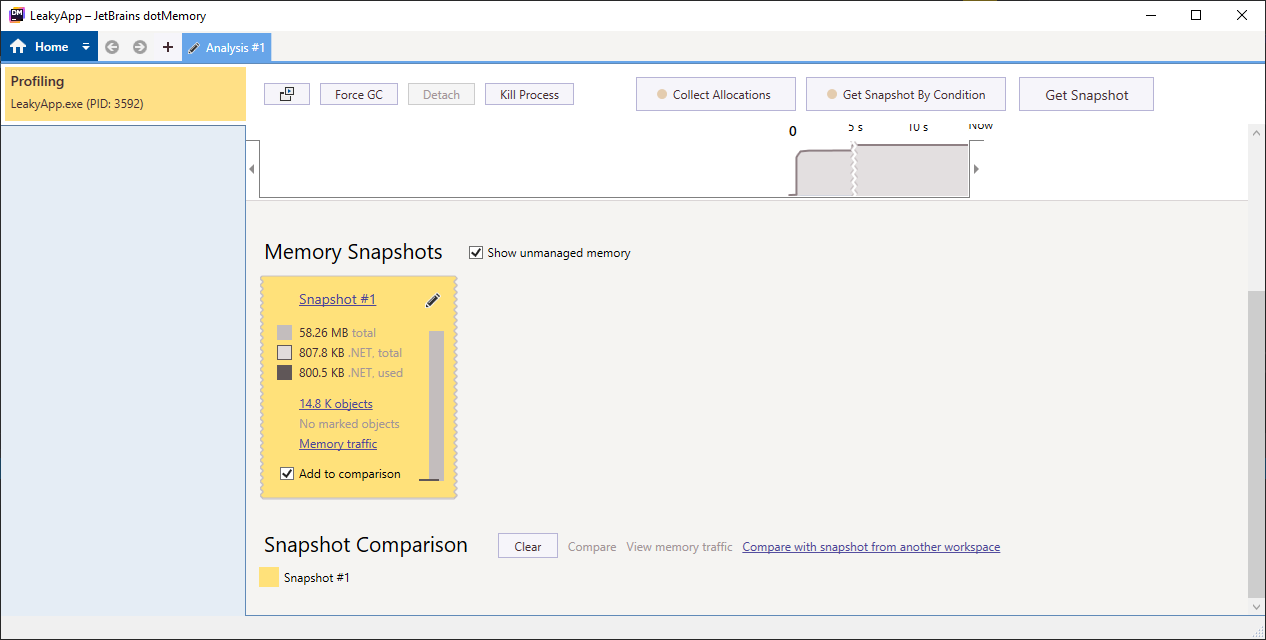
Take another snapshot of currently used memory, after which you will get output similar to below image.
In the image below you can see that our objects count went from 14k to 26k approx. This is fine as we have 50 windows opened which are utilizing this memory.
Step 5
Click on the Stop button to close all the 50 windows altogether, thus decreasing the load on the memory.
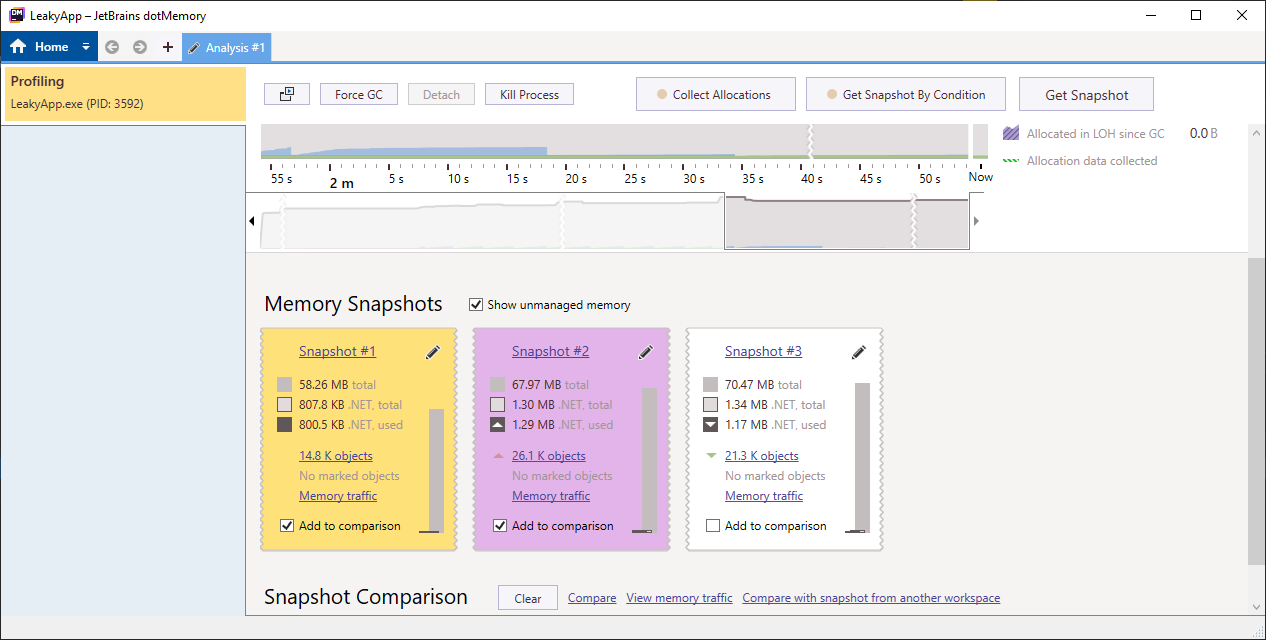
Step 6
Again take the snapshot.
Now, we expect that our alive objects count will decrease in the third snapshot, but it stills live around 21k. This concludes that there is some memory leak going around between the Start and Stop button action.
Step 7
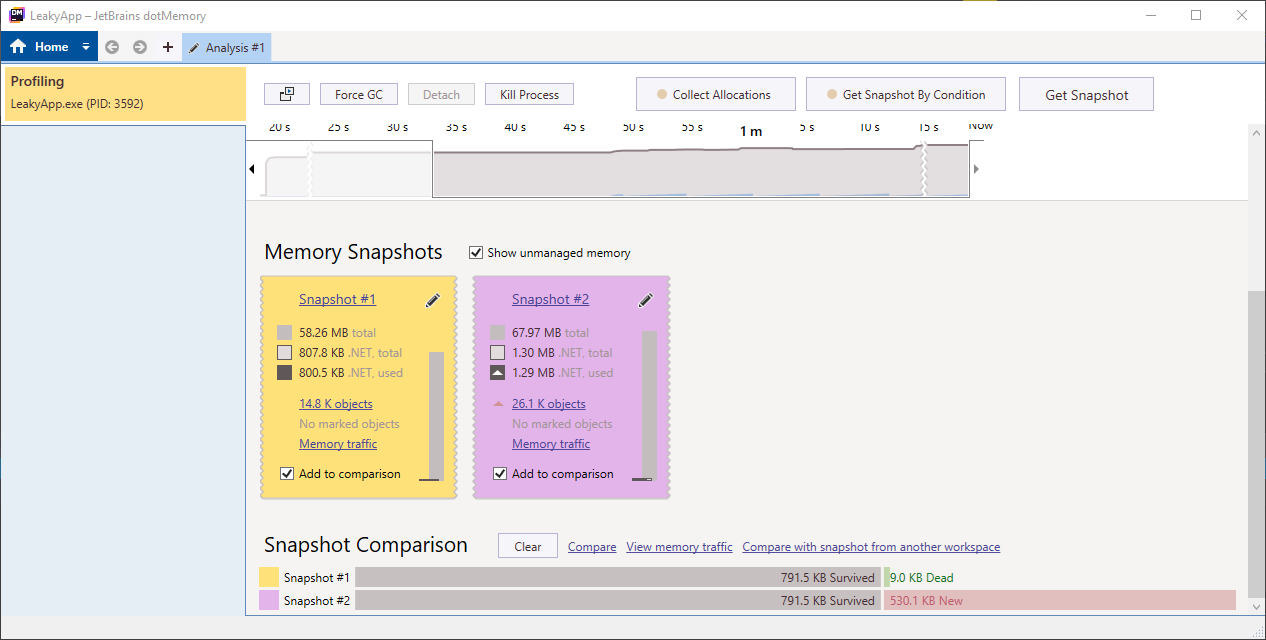
To get more information about this leak, check the “Add to comparison” box from Snapshot #1 and Snapshot #3 and click on the Compare button.
Step 8
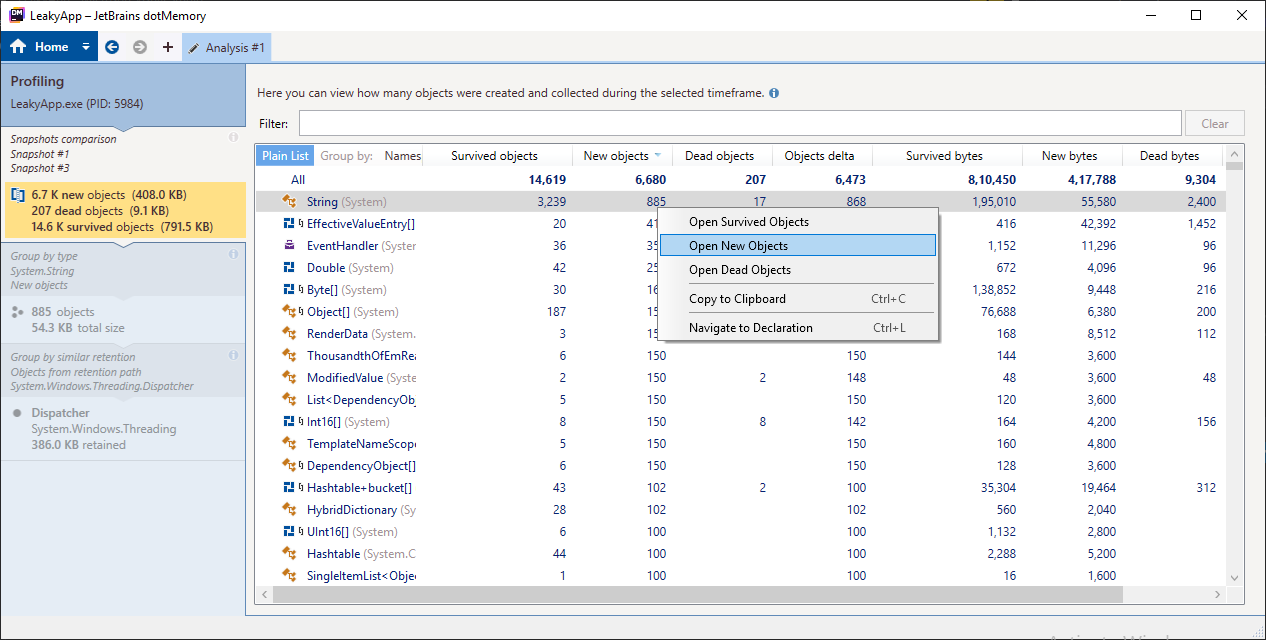
Here you will see the diff between the two snapshots in a table-like structure along with the count of the object and datatype in each row.
Now,
In the first row, where data type is String, right-click on the “New objects” column and select “Open New Objects” option from the Context Menu.
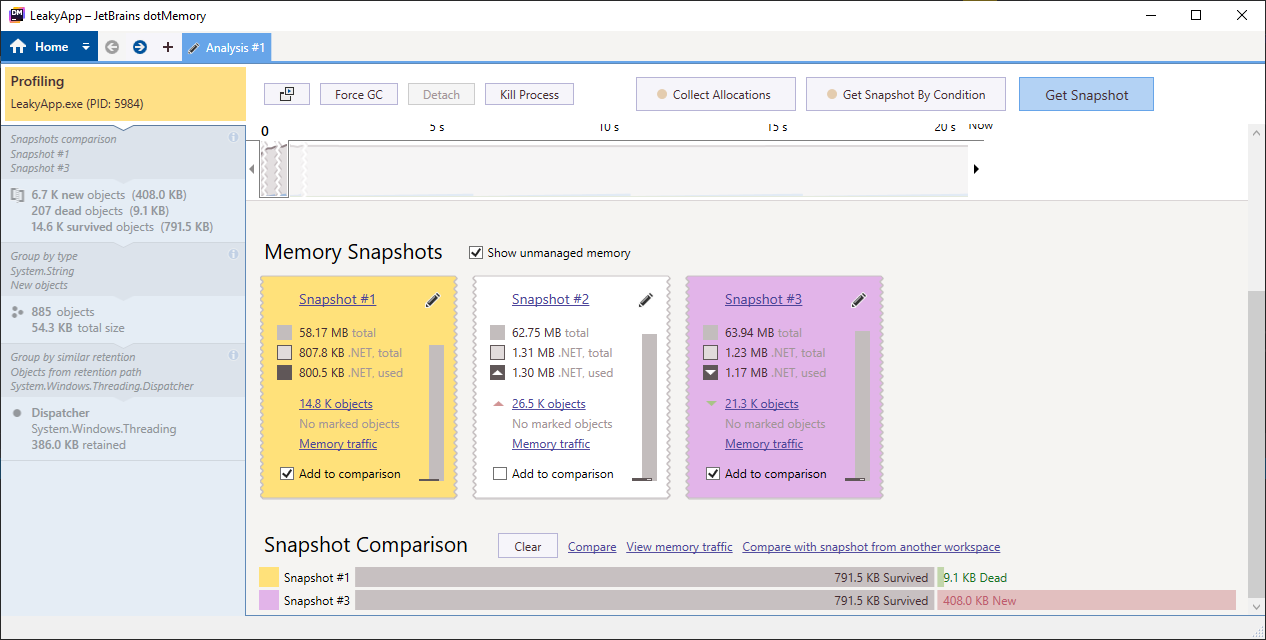
Step 9
Now, select the Dominators tab from the above section and you will see the output similar to the image below.
From the output, you can conclude that around 700 objects are retained by the Dispatcher which is dominators of string objects along with some other objects. Getting rid of this dispatcher will help reclaim a lot of memory, thus removing lots of objects from the heap.
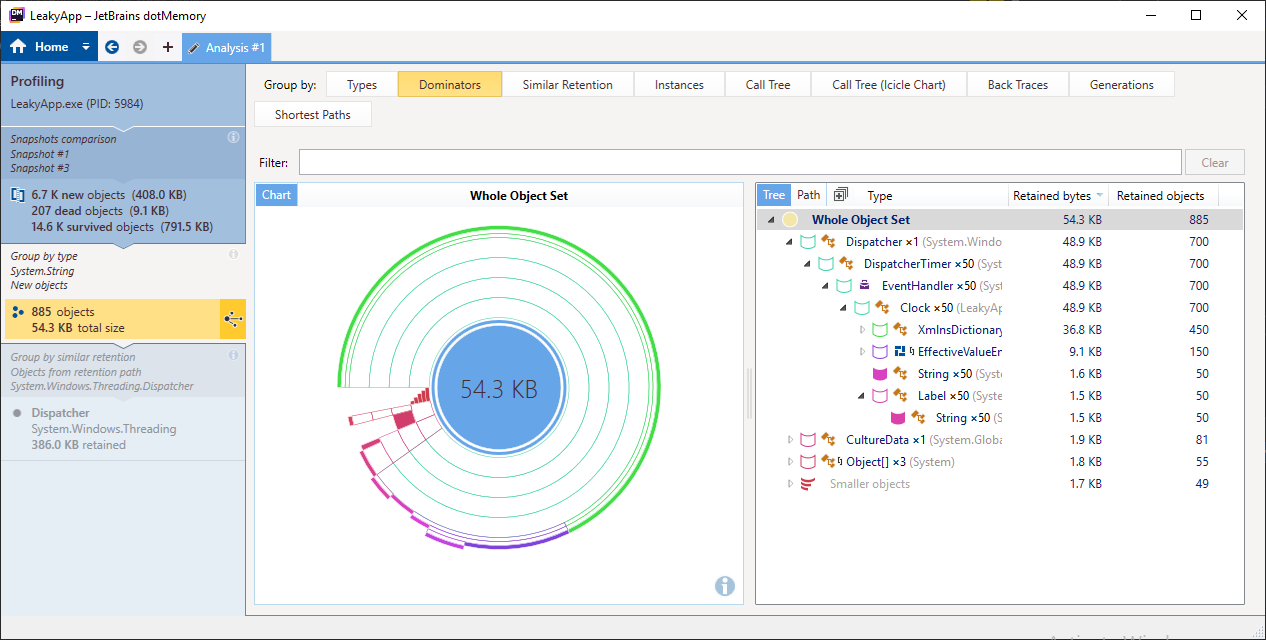
Let’s get rid of those dispatchers.
Analysing Non-Leaky App
To get rid of those dispatchers, unregister Clock class UpdateTime method from the dispatcher Tick event within OnClosed window method.
And then follow all the steps discussed above, you will find the result similar to the below image.
Final Result
In final result you can see that we got rid of those dispatchers, thus removing lots of objects from the heap.
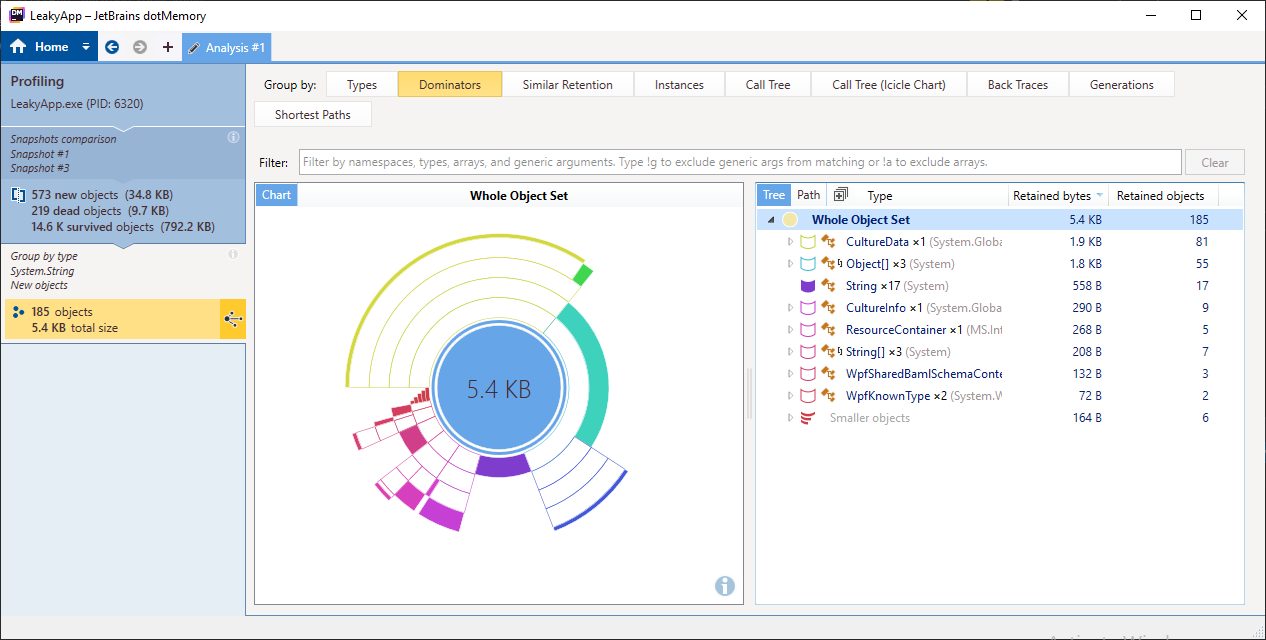
So as you can see, some understanding of theory can really pay off. dotMemory can display dominator sets and group objects by retention paths and these are two different ways of looking at the same problem.
And the only problem with dotMemory is that it’s a pretty heavy tool, and requires installation, so I wouldn’t put it on a production server, for example. And so in the next demo, we’re going to see a more lightweight approach, which is suitable for production environments, but it makes things a little harder to diagnose.
Memory Leak Analysis With PerfView
Analysing Leaky App
PerfView is a free ETW-based tool, for memory leak investigations. And PerfView can perform two very important optimizations automatically, it can do heap sampling and folding.
PerfView is a slightly less-sophisticated tool, so you don’t get nice dominator trees, and beautifully-formatted retention paths, but you do get the basic information that can guide you towards a resolution.
And another thing that makes PerfView suitable for production use, is that it doesn’t require any installations. It’s a single executable that you can copy over to a production box, and delete when you’re done. And there’s one more thing that’s even more incredible.
All other memory profilers will freeze your application when taking a heap snapshot, and PerfView is the only one that won’t. It can capture a heap snapshot while your application code is running.
So, let’s get started.
Step 1
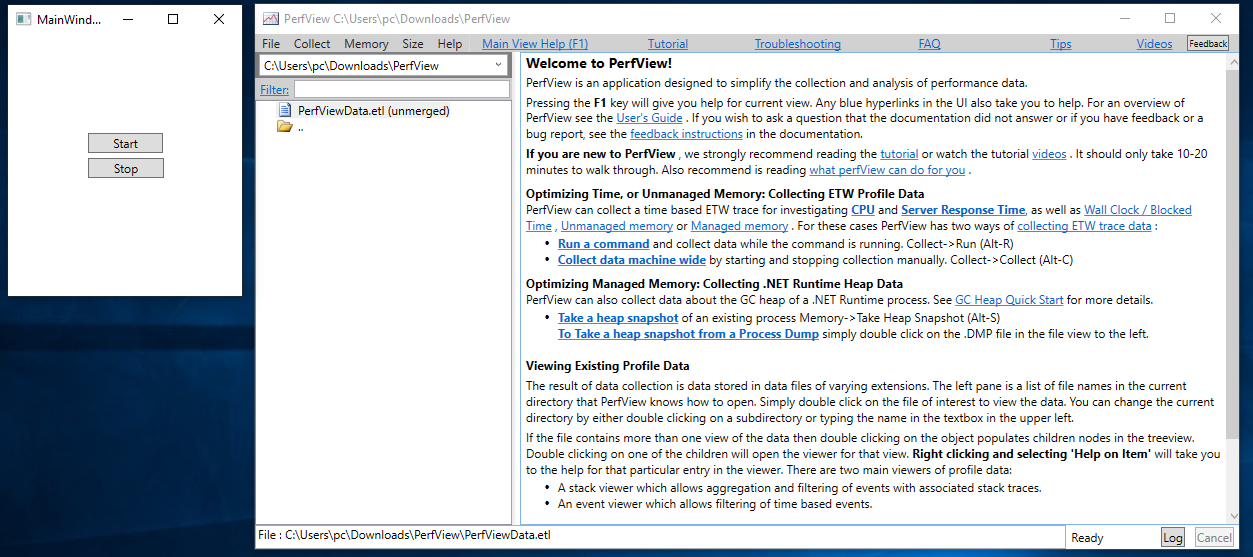
Download PerfView from here and run both Perfview and LeakApp side by side.
So again, here is the application. And here is PerfView.
Step 2
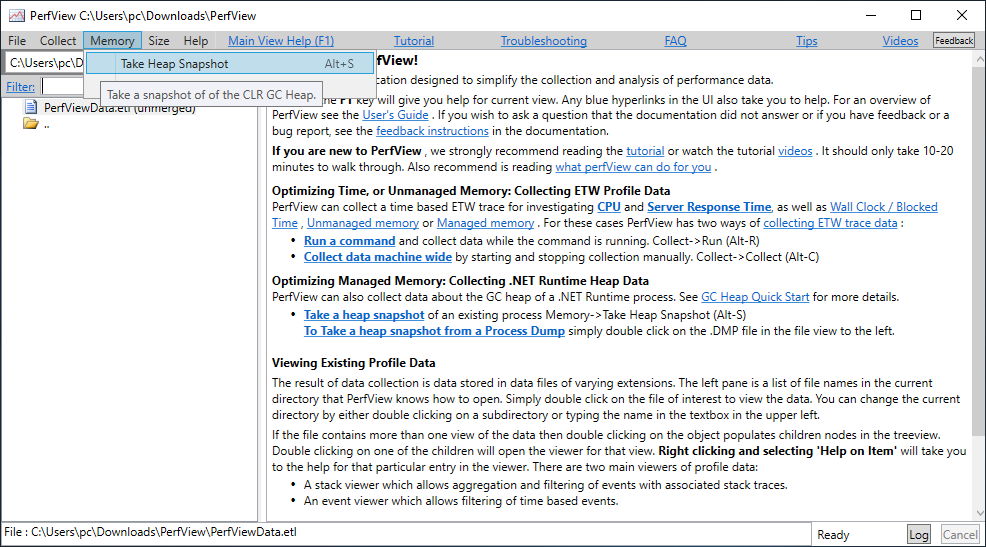
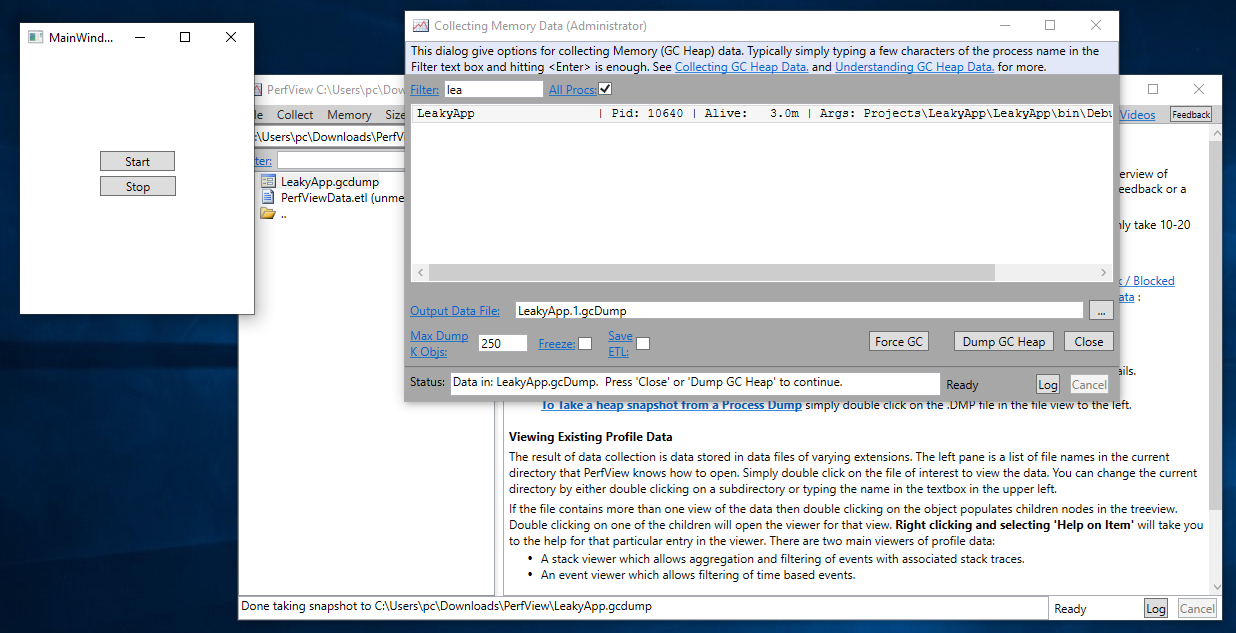
So now, I’m going to use PerfView to capture two heap snapshots and analyze those snapshots. And I am going to use Memory > Take heap snapshot option from the menu.
Step 3
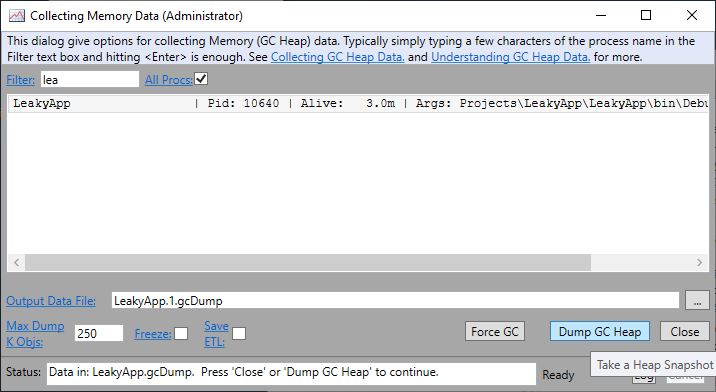
In “Collecting Memory Data” dialog box find the LeakyApp process using the filter. Then, Click on the “Dump GC Heap” button to take the first snapshot.
Step 4
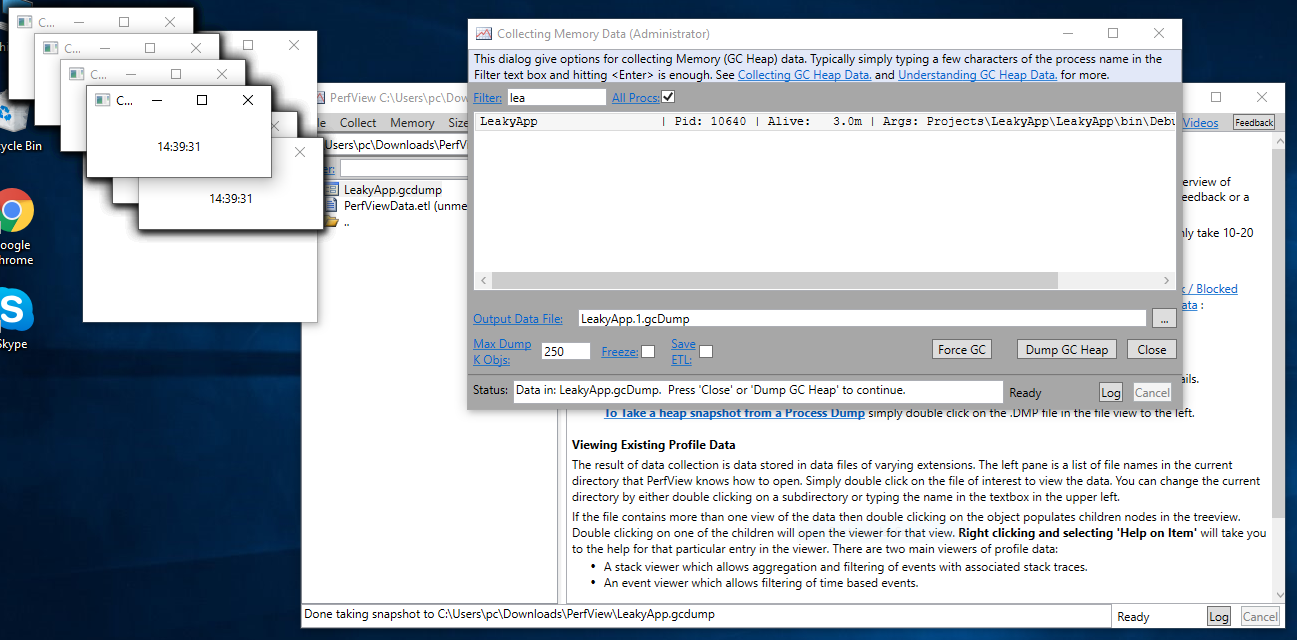
Click on the Start button and then Stop button in our leaky app.
Step 5
Again, click on the “Dump GC Heap” button to take the second snapshot.
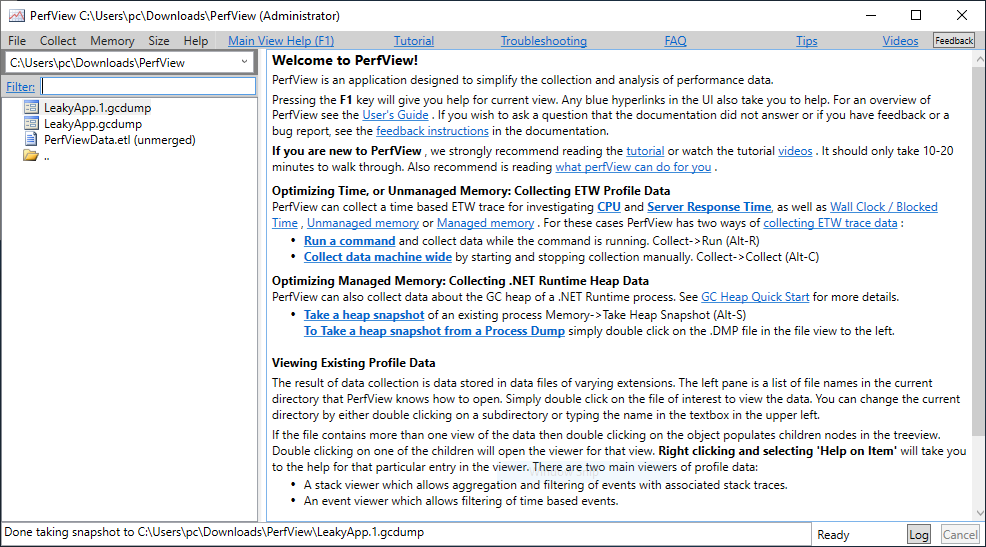
Step 6
Now, you will be able to see two gcdump files in the left panel of PerfView window.
Step 7
Open both files side by side and in the second file, select Diff > With BaseLine from the menu.
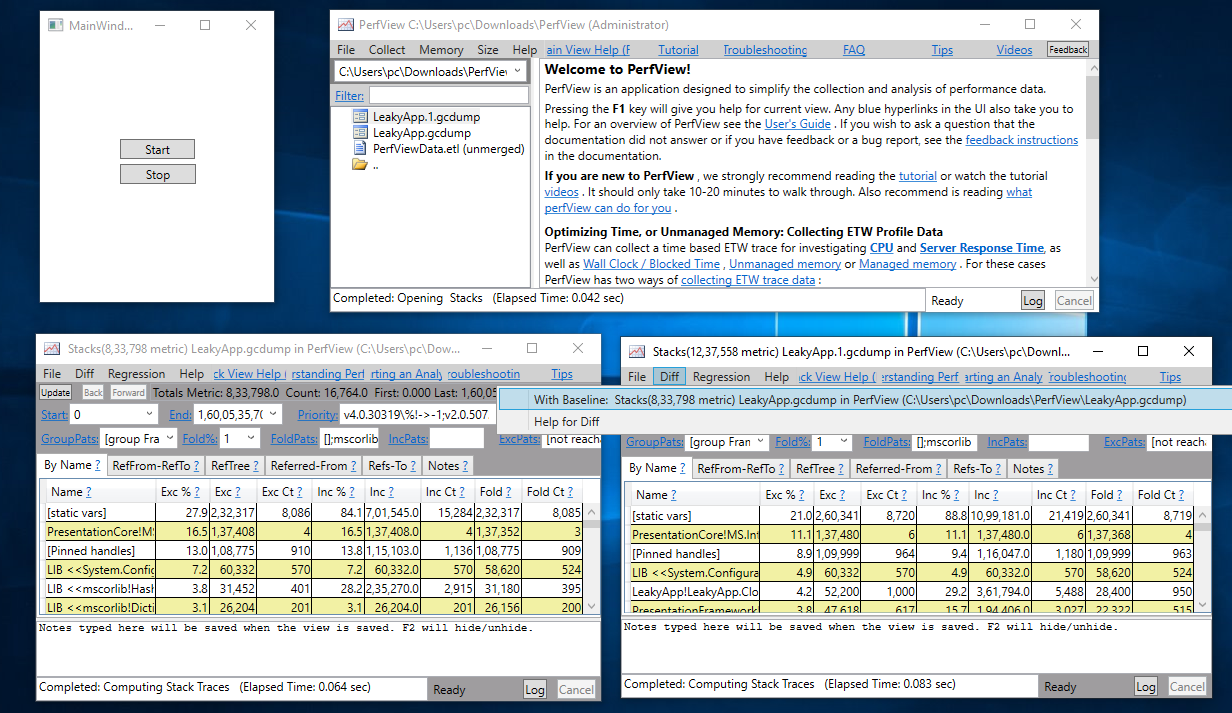
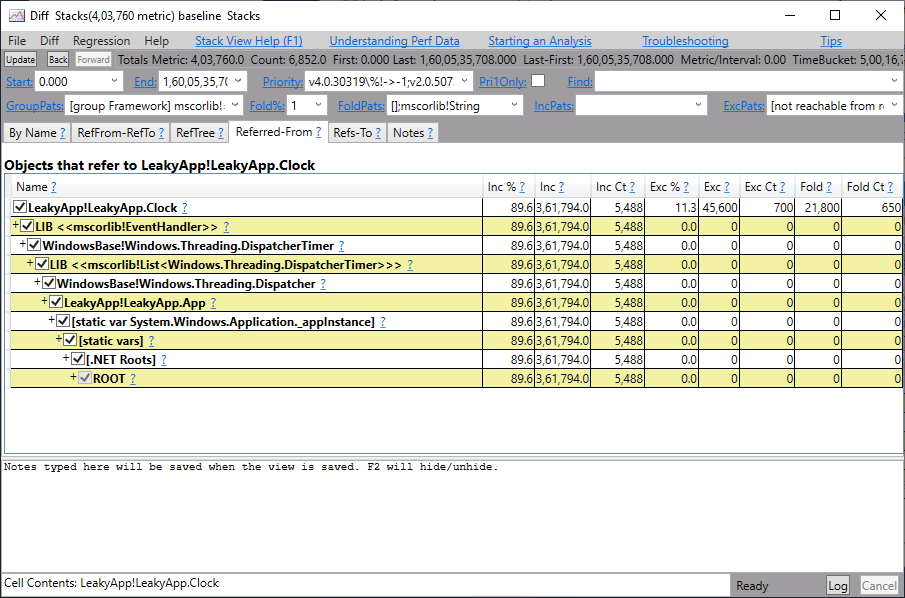
Step 8
You will get the output similar to the image below. In the diff below you can see that 11% of retained objects are of type LeakyApp.Clock along with some other objects. Click on LeakyApp.Clock.
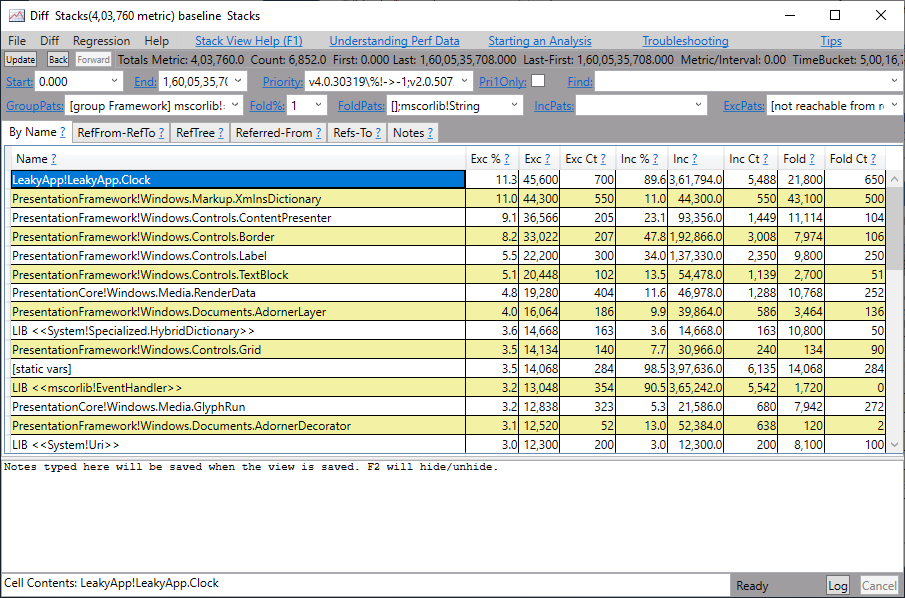
Step 9
After that,
You will get caller tree-like structure that shows a reference chain up to the root. You can see that LeakyApp.Clock object is retained by Windows.Threading.Dispatcher type. Thus, we can conclude that getting rid of this dispatcher will help reclaim a lot of memory, thus removing lots of objects from the heap.
Memory Leak Analysis With OzCode
Analysing Leaky App
OzCode is a Visual Studio Extension for debugging. It provides various debugging feature such as:
- LINQ Debugging - Easily navigate the LINQ pipeline and visualize the flow of the LINQ query.
- Tracing - Easily diagnose complicated multi-threaded bugs by analyzing a linear log of execution, right from within Visual Studio.
- Show all instances - you can effortlessly find specific objects in memory. Easily find any objects that contain a specific value, and find out why they’re still there.
and much more.
In our memory leak analysis demo, we will use “Show all instances” feature of OzCode to find out the memory leak.
So, let’s get started.
Step 1
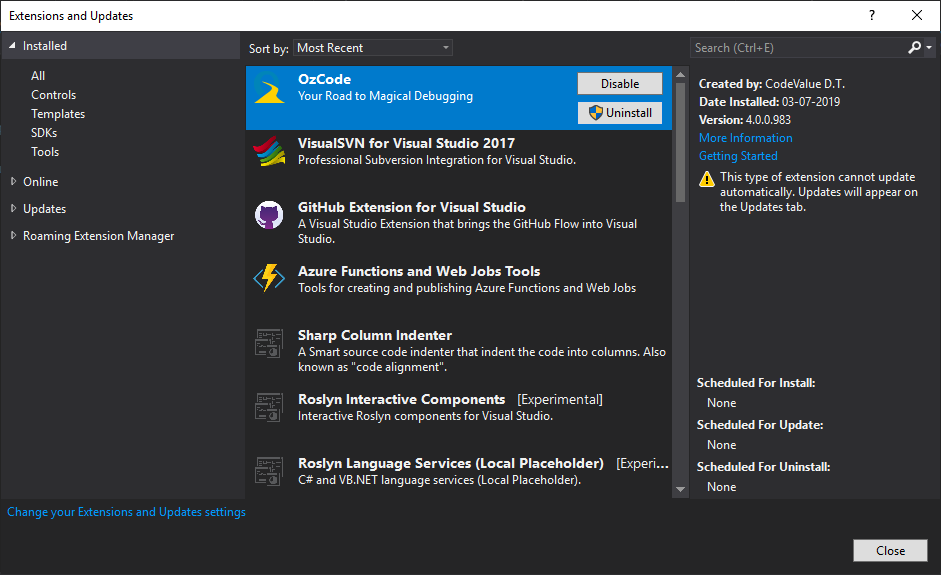
Install the OzCode extension for Visual Studio. You can also download the extension from the OzCode website.
Step 2
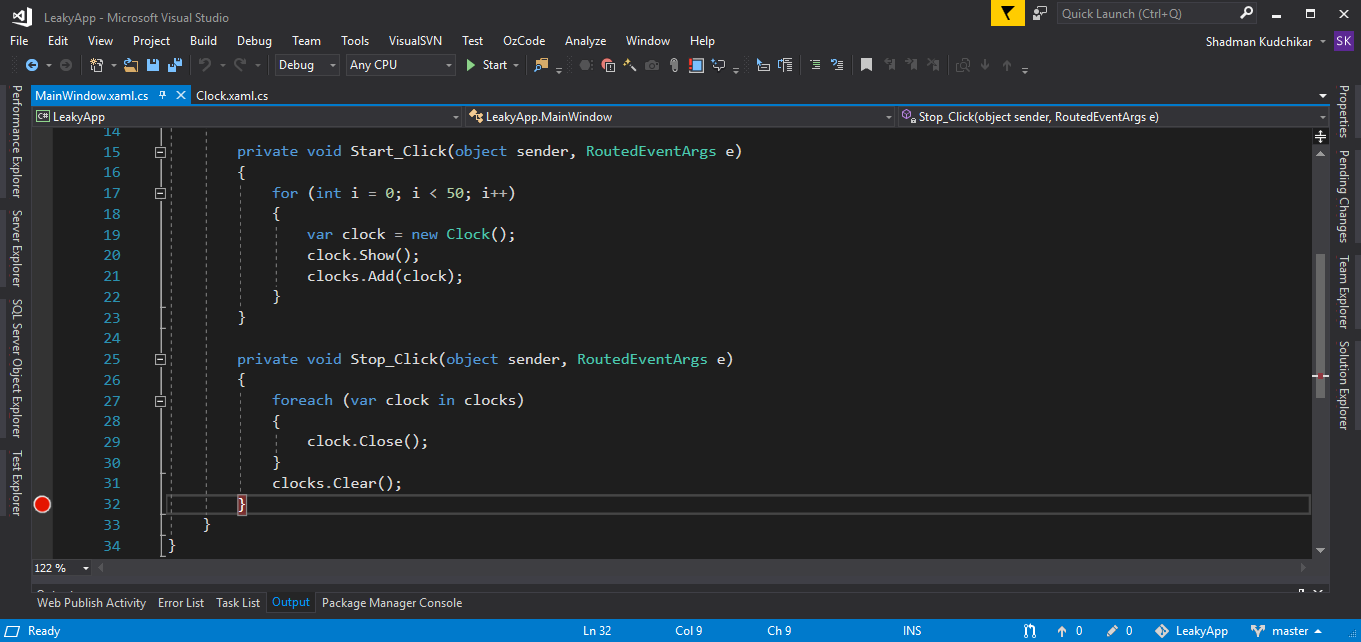
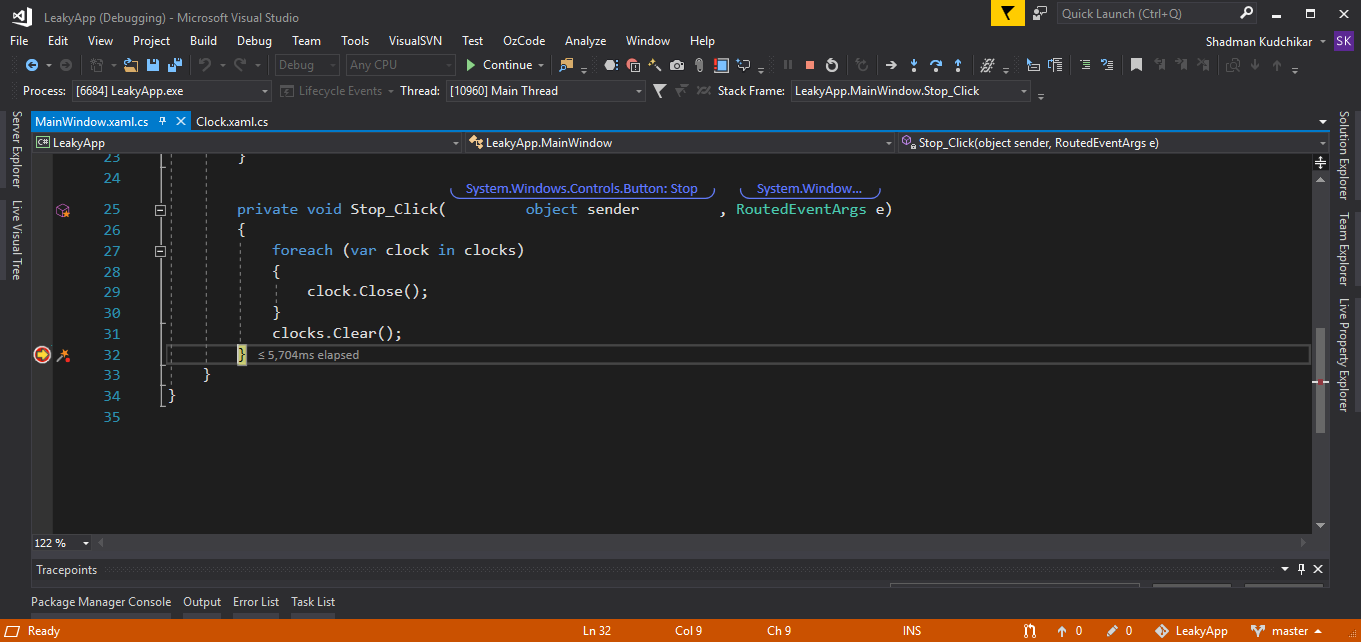
Put a breakpoint at the end of the Stop_Click method in the MainWindow class.
Step 3
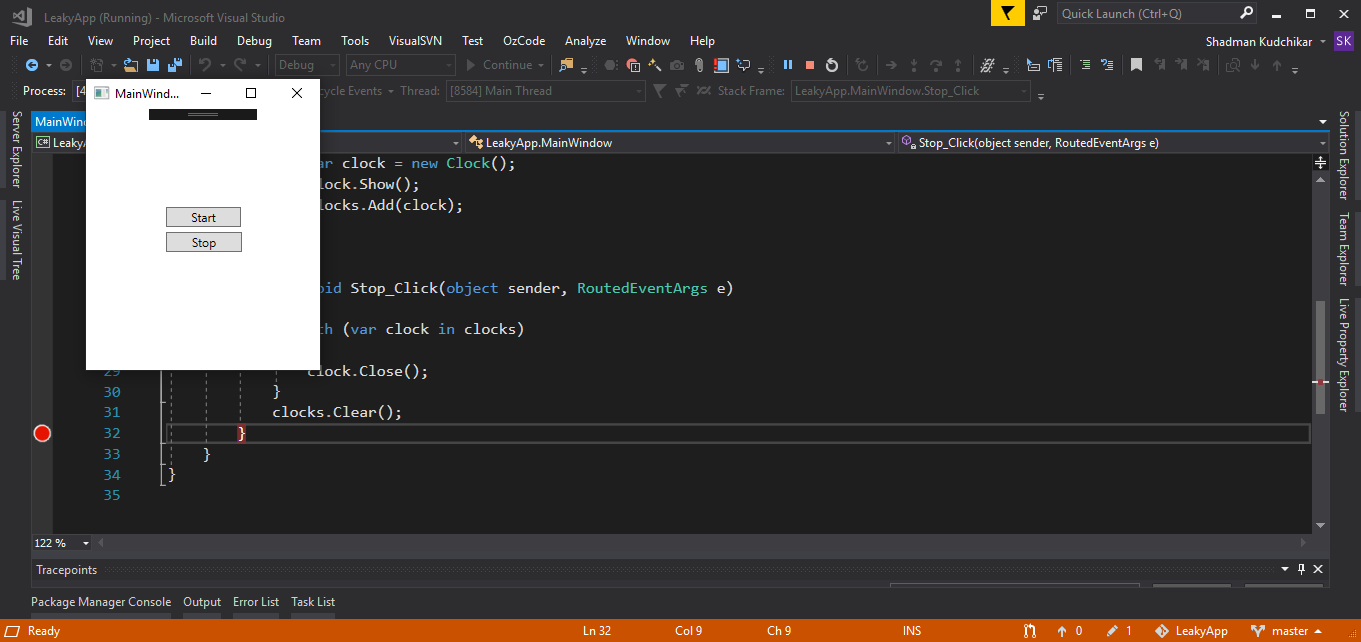
Run the program and click on the Start button and then on the Stop button.
Step 4
Your program will hit at the end of the Stop_Click method breakpoint. Just click on the Continue button and again repeat the 3rd Step. Now, you will again hit the breakpoint.
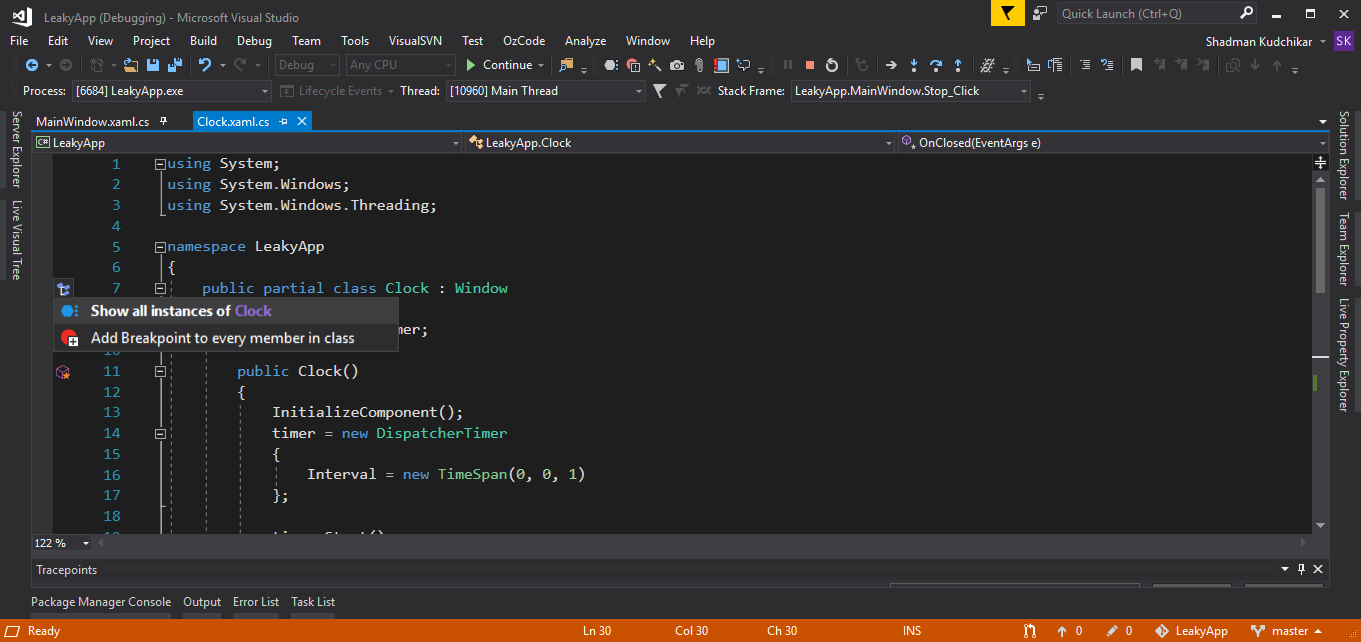
Step 5
Go to Clock.xaml.cs file and on the left in margin indicator you will able to see some icons. Click on the icon which is to the left of Clock class definition. And select the “Show all instances of Clock” option.
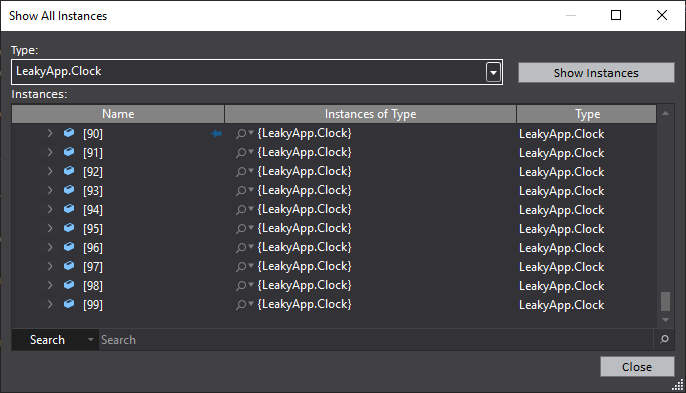
Step 6
Show all instance dialog box will appear showing all the instances of Clock object which are retained in memory. You will find that there are a total of 100 retained objects in the memory.
So when we pressed Start and Stop button twice in total 100 instances got created and none of them got collected by the garbage collector, even though we removed there reference from the list.
Thus we can conclude that some memory leak is happening which retaining our Clock objects.
Analysing Non-Leaky App
Unregister Clock class UpdateTime method from the dispatcher Tick event within OnClosed window method.
And then follow all the steps discussed above, you will find the result similar to the below image.
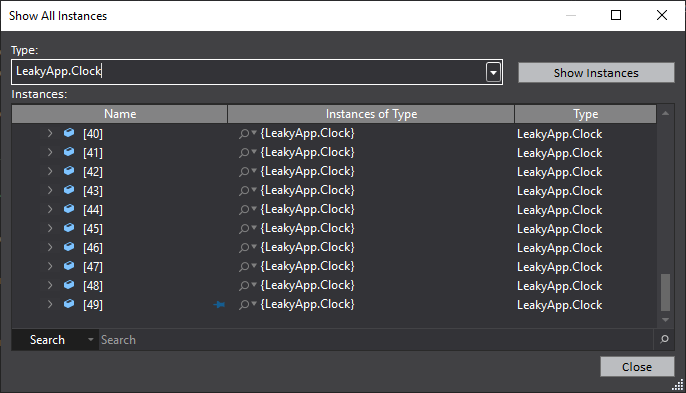
You can see that in the final result there are only 50 Clock objects retained even though we pressed Start and Stop button twice. So no matter how many times you Start and Stop the Clock windows, only 50 objects will be retained in the memory.
Further Reading
-
Find, Fix, and Avoid Memory Leaks in C# .NET: 8 Best Practices by Michael Shpilt - Finding, Fixing and learning to Avoid Memory Leaks is an important skill. In this article Michael list 8 best practice techniques that will teach you to detect when there’s a memory leak problem in the application, to find the specific memory leak and to fix it.
-
Making .NET code less allocatey - Allocations and the Garbage Collector by Maarten Balliauw - In this article Maarten explains when and where memory is allocated and discusses the use of efficient coding to help our GC spend less CPU time allocating and freeing memory thus making our applications faster and less “allocatey”.
-
Lapsed-listeners – Memory leaks in subscriber-publisher scenarios by Damien Guard - There exists a ‘gotcha’ in .NET (and other programming environments) whereby an object has subscribed to other objects published event will not be garbage collected when you expect because the environment itself holds a reference to the subscriber inside the event notification system. In this post, Damien provides possible solutions for the Memory leaks in subscriber-publisher scenarios.
-
Hidden Pitfalls With Object Initializers by Phil Haack - In this post, Phil discusses how the use of object initializer can cause a memory leak if an exception is thrown while setting the property of a disposable field, leading to a dangling undisposed instance.
References
- https://developers.google.com/web/tools/chrome-devtools/memory-problems/memory-101
- https://docs.microsoft.com/en-us/windows/win32/win7appqual/preventing-memory-leaks-in-windows-applications
- https://stackoverflow.com/questions/312069/the-best-memory-leak-definition
- https://stackoverflow.com/questions/672810/what-are-the-most-common-and-often-overlooked-causes-of-memory-leaks-in-manage
- https://michaelscodingspot.com/find-fix-and-avoid-memory-leaks-in-c-net-8-best-practices/
- https://en.wikipedia.org/wiki/Memory_leak
- https://docs.microsoft.com/en-us/visualstudio/profiling/memory-usage?view=vs-2019
- https://docs.microsoft.com/en-us/visualstudio/profiling/memory-usage-without-debugging2?view=vs-2019
- https://en.wikipedia.org/wiki/Resource_acquisition_is_initialization
- https://devblogs.microsoft.com/visualstudio/analyze-cpu-memory-while-debugging/
- https://stackoverflow.com/questions/4526829/why-and-how-to-avoid-event-handler-memory-leaks
Subscribe to Code with Shadman
Get the latest posts delivered right to your inbox